WHY SHOULD YOU CHOOSE TO BOOK A TOUR AT HAIVENU?

Competitive tour prices

Book tours quickly & easily

Good service quality
Cultural Classic


1,130 $
Family Adventure through Vietnam: A Perfect Blend of Culture, Nature and Fun This specially curated family tour in Vietnam offers the perfect balance of outdoor adventures, cultural immersion, and hands-on experiences, designed to engage travellers of all ages – from curious kids to adults seeking authentic exploration. Whether you’re planning a Vietnam holiday with kids...


1,341 $
✨ Tour Overview: 10-Day Vietnam Family Adventure – Culture, Cuisine & Nature Embark on a 10-day family journey through Vietnam, where vibrant culture, breathtaking landscapes, and flavourful cuisine await at every turn. This carefully curated itinerary is designed for families and curious travellers seeking a perfect balance of local experiences, relaxation, and fun-filled activities. Begin...


1,666 $
✨ Tour Overview: 15-Day Vietnam Family Adventure – Culture, Nature & Island Escape Embark on a captivating 15-day journey across Vietnam, designed for families and culture-loving travellers seeking a balanced blend of authentic local experiences, natural wonders, and moments of relaxation. From the historic charm of Hanoi’s Old Quarter to the serene mountain landscapes of...


1,874 $
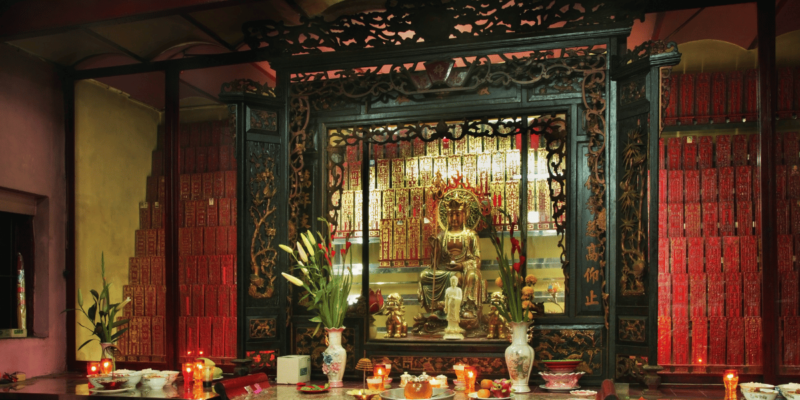
12-Day Vietnam Cultural & Heritage Tour – From Hanoi to Hoi An Embark on an enriching 12-day Vietnam cultural tour, crafted for discerning travelers seeking an immersive experience that blends history, architecture, culinary traditions, and local lifestyles. From the vibrant streets of Hanoi to the timeless charm of Hoi An, this itinerary showcases the depth...
FOR Family Holidays
1,130 $
Family Adventure through Vietnam: A Perfect Blend of Culture, Nature and Fun This specially curated family tour in Vietnam offers the perfect balance of outdoor adventures, cultural immersion, and hands-on experiences, designed to engage travellers of all ages – from curious kids to adults seeking authentic exploration. Whether you’re planning a Vietnam holiday with kids...
1,341 $
✨ Tour Overview: 10-Day Vietnam Family Adventure – Culture, Cuisine & Nature Embark on a 10-day family journey through Vietnam, where vibrant culture, breathtaking landscapes, and flavourful cuisine await at every turn. This carefully curated itinerary is designed for families and curious travellers seeking a perfect balance of local experiences, relaxation, and fun-filled activities. Begin...
1,666 $
✨ Tour Overview: 15-Day Vietnam Family Adventure – Culture, Nature & Island Escape Embark on a captivating 15-day journey across Vietnam, designed for families and culture-loving travellers seeking a balanced blend of authentic local experiences, natural wonders, and moments of relaxation. From the historic charm of Hanoi’s Old Quarter to the serene mountain landscapes of...


1,920 $
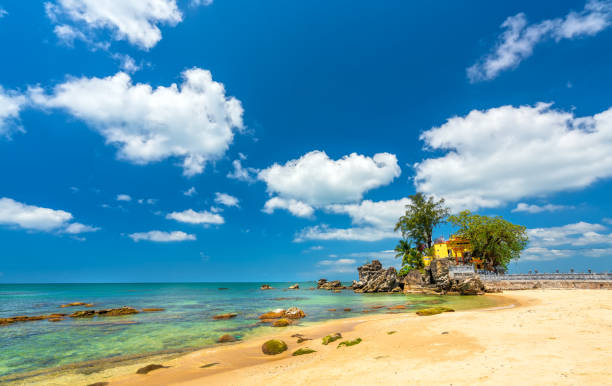
✨ Tour Overview: Vietnam Discovery – 14 Days from Hanoi to Phu Quoc Embark on a 14-day journey through the heart and soul of Vietnam, from the ancient streets of Hanoi to the sun-drenched shores of Phu Quoc Island. This immersive itinerary offers the perfect blend of cultural discovery, natural wonders, culinary delights, and coastal...
For active Travellers


✨ Tour Overview: 4-Day Luxury Escape to Phu Quoc Island Indulge in the ultimate tropical getaway with this 4-day luxury retreat to Phu Quoc Island, Vietnam’s island gem in the Gulf of Thailand. Known for its crystal-clear waters, palm-fringed beaches, and untouched natural beauty, Phu Quoc is the perfect destination for travellers seeking both relaxation...


✨ Tour Overview: 4-Day Dalat Discovery from Ho Chi Minh City Escape the hustle of Ho Chi Minh City and journey into the cool, pine-covered highlands of Dalat, Vietnam’s most romantic mountain town. This 4-day Dalat discovery tour combines the city’s charming colonial history, natural beauty, and rich agricultural culture — perfect for travellers seeking...


✨ Tour Overview: 3-Day Luxury Escape to Avana Retreat, Mai Chau Unwind in complete harmony with nature on this 3-day luxury retreat to Avana, nestled in the emerald mountains of Mai Chau, just a few hours from Hanoi. Designed for peace-seekers, couples, and wellness-focused travellers, this experience invites you to slow down, breathe deeply, and...


✨ Tour Overview: A Royal Journey through Halong & Lan Ha Bay with Emperor Cruises Step into the world of imperial elegance with this 3-day 2-night luxury cruise through the awe-inspiring seascapes of Halong Bay and Lan Ha Bay. Aboard the exquisite Emperor Cruises, inspired by the lavish lifestyle of Emperor Bao Dai, you’ll experience...
FOR Honey moons
✨ Tour Overview: 4-Day Luxury Escape to Phu Quoc Island Indulge in the ultimate tropical getaway with this 4-day luxury retreat to Phu Quoc Island, Vietnam’s island gem in the Gulf of Thailand. Known for its crystal-clear waters, palm-fringed beaches, and untouched natural beauty, Phu Quoc is the perfect destination for travellers seeking both relaxation...
✨ Tour Overview: 4-Day Dalat Discovery from Ho Chi Minh City Escape the hustle of Ho Chi Minh City and journey into the cool, pine-covered highlands of Dalat, Vietnam’s most romantic mountain town. This 4-day Dalat discovery tour combines the city’s charming colonial history, natural beauty, and rich agricultural culture — perfect for travellers seeking...
✨ Tour Overview: 3-Day Luxury Escape to Avana Retreat, Mai Chau Unwind in complete harmony with nature on this 3-day luxury retreat to Avana, nestled in the emerald mountains of Mai Chau, just a few hours from Hanoi. Designed for peace-seekers, couples, and wellness-focused travellers, this experience invites you to slow down, breathe deeply, and...
✨ Tour Overview: A Royal Journey through Halong & Lan Ha Bay with Emperor Cruises Step into the world of imperial elegance with this 3-day 2-night luxury cruise through the awe-inspiring seascapes of Halong Bay and Lan Ha Bay. Aboard the exquisite Emperor Cruises, inspired by the lavish lifestyle of Emperor Bao Dai, you’ll experience...
For Luxury

6,894 $
✨ Luxury Vietnam Honeymoon – 14 Days of Romance, Culture & Serenity Embark on an unforgettable 14-day honeymoon across Vietnam, crafted for couples seeking romance, cultural depth, and refined luxury. From the timeless charm of Hanoi’s Old Quarter to the emerald waters of Ha Long Bay, the tranquil mountains of Mai Chau to the untouched...

3,630 $
Embark on a meticulously curated 8-day luxury Vietnam itinerary, designed by seasoned travel experts with deep local knowledge and years of experience in crafting high-end, personalized escapes. This is more than just a holiday—it’s a transformative journey where elegance, culture, and nature converge in unforgettable ways. Your adventure begins aboard the prestigious Au Co Cruise,...